October’s real estate numbers are in. Sales picked up from September in Cornerstone’s Hamilton–Burlington area and in the Niagara Association of REALTORS® market, while both remained below last October. The number I keep coming back to is new listings. Fewer homes are coming onto the market, and I’m watching what that means for buyers and sellers heading into the new year. Cornerstone’s regional statistics · Niagara’s October report
October at a glance
Percentages in parentheses compare October 2026 with October 2025.
| Market measure | Hamilton | Burlington | Niagara |
|---|---|---|---|
| Home sales | 424 (−8.0%) | 178 (−5.8%) | 512 (−0.4%) |
| New listings | 1,003 (−14.9%) | 330 (−13.8%) | 1,226 (−12.1%) |
| MLS® benchmark price | $667,500 (−4.3%) | $879,800 (+0.3%) | $566,100 (−3.8%) |
| Average days on market | 40 | 32 | 48 |
Hamilton and Burlington figures come from Cornerstone. Niagara figures cover the Niagara Association of REALTORS® reporting area. Cornerstone city statistics · Niagara’s October report
Hamilton and Burlington
Across Cornerstone’s broader Hamilton, Burlington, Haldimand County, and Niagara North reporting area, 709 homes sold in October, up 10.6% from September and down 5.3% from a year earlier. The number of homes for sale fell 12.6% year over year, and months of supply eased from 4.7 in September to 4.6 in October. Cornerstone’s regional statistics
Hamilton recorded 424 sales and 4.8 months of supply. The average sale price was $724,461, down 7.4% from last October. Citywide sales were lower, but Dundas, Ancaster, and Glanbrook each recorded more sales than a year earlier. Cornerstone’s Hamilton statistics
Burlington recorded 178 sales and 3.4 months of supply. The average sale price rose 2.2% year over year to $1,051,747, and the benchmark price was nearly flat. New listings fell faster than sales, and homes sold in an average of 32 days. Cornerstone’s Burlington statistics
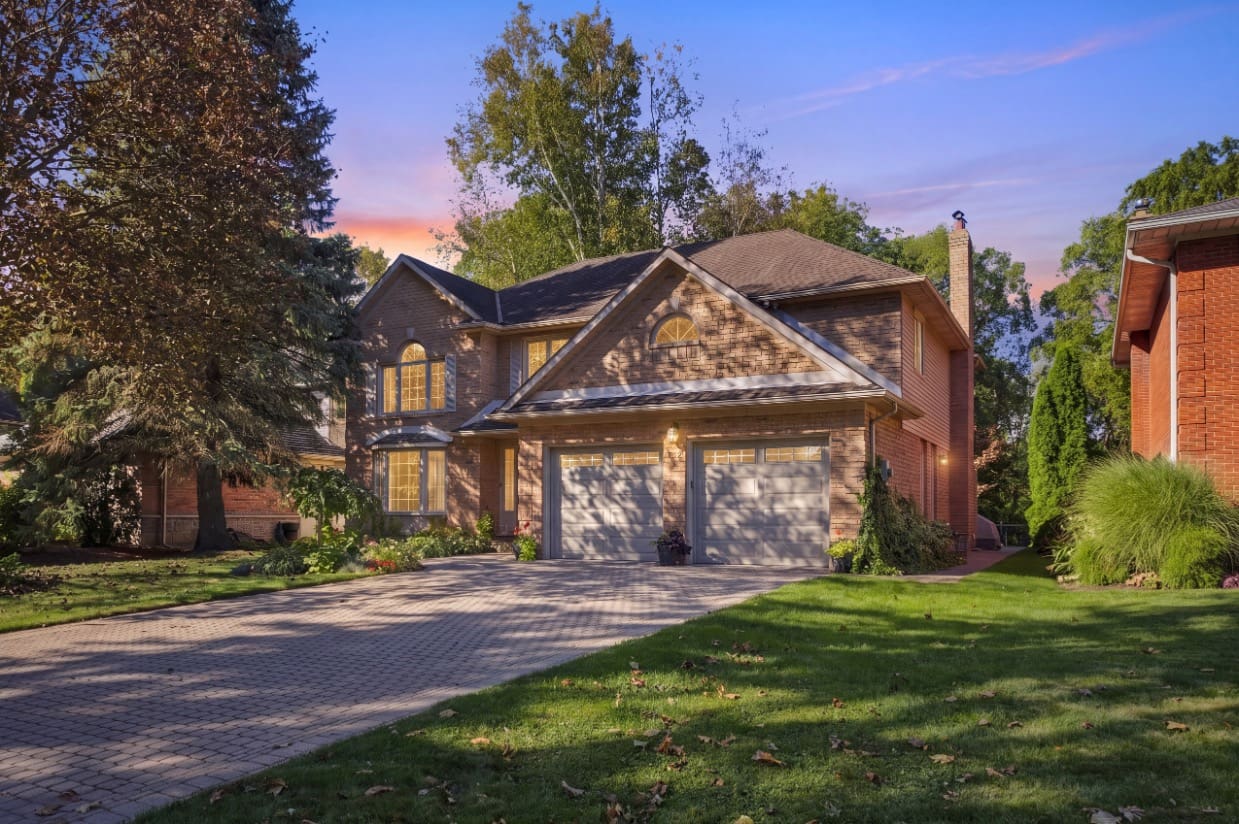
Hamilton community breakdown
Prices below are rolling 12-month averages through October. Sales counts are for October alone. Each year-over-year change compares the same period in 2026 and 2025.
| Community | Average sale price | Price change | October sales | Sales change |
|---|---|---|---|---|
| Flamborough | $1,211,942 | −1.6% | 12 | −20.0% |
| Dundas | $900,929 | −8.7% | 28 | +16.7% |
| Ancaster | $1,081,112 | −5.9% | 39 | +2.6% |
| Waterdown | $935,854 | −2.1% | 21 | −19.2% |
| Stoney Creek | $759,070 | −6.4% | 56 | −1.8% |
| Glanbrook | $773,090 | −8.5% | 37 | +68.2% |
Glanbrook’s increase was the largest in the table, from 22 sales last October to 37 this October. The counts help put the percentages in perspective, especially in communities where a handful of transactions can swing the result. Cornerstone’s Hamilton community charts
Niagara
Niagara recorded 512 sales, up from 504 in September and just below the 514 recorded last October. New listings fell from 1,395 to 1,226 year over year. The benchmark price was $566,100, down 0.2% from September and 3.8% from a year earlier. Homes took an average of 48 days to sell, compared with 52 days last October. Niagara Association of REALTORS® October report
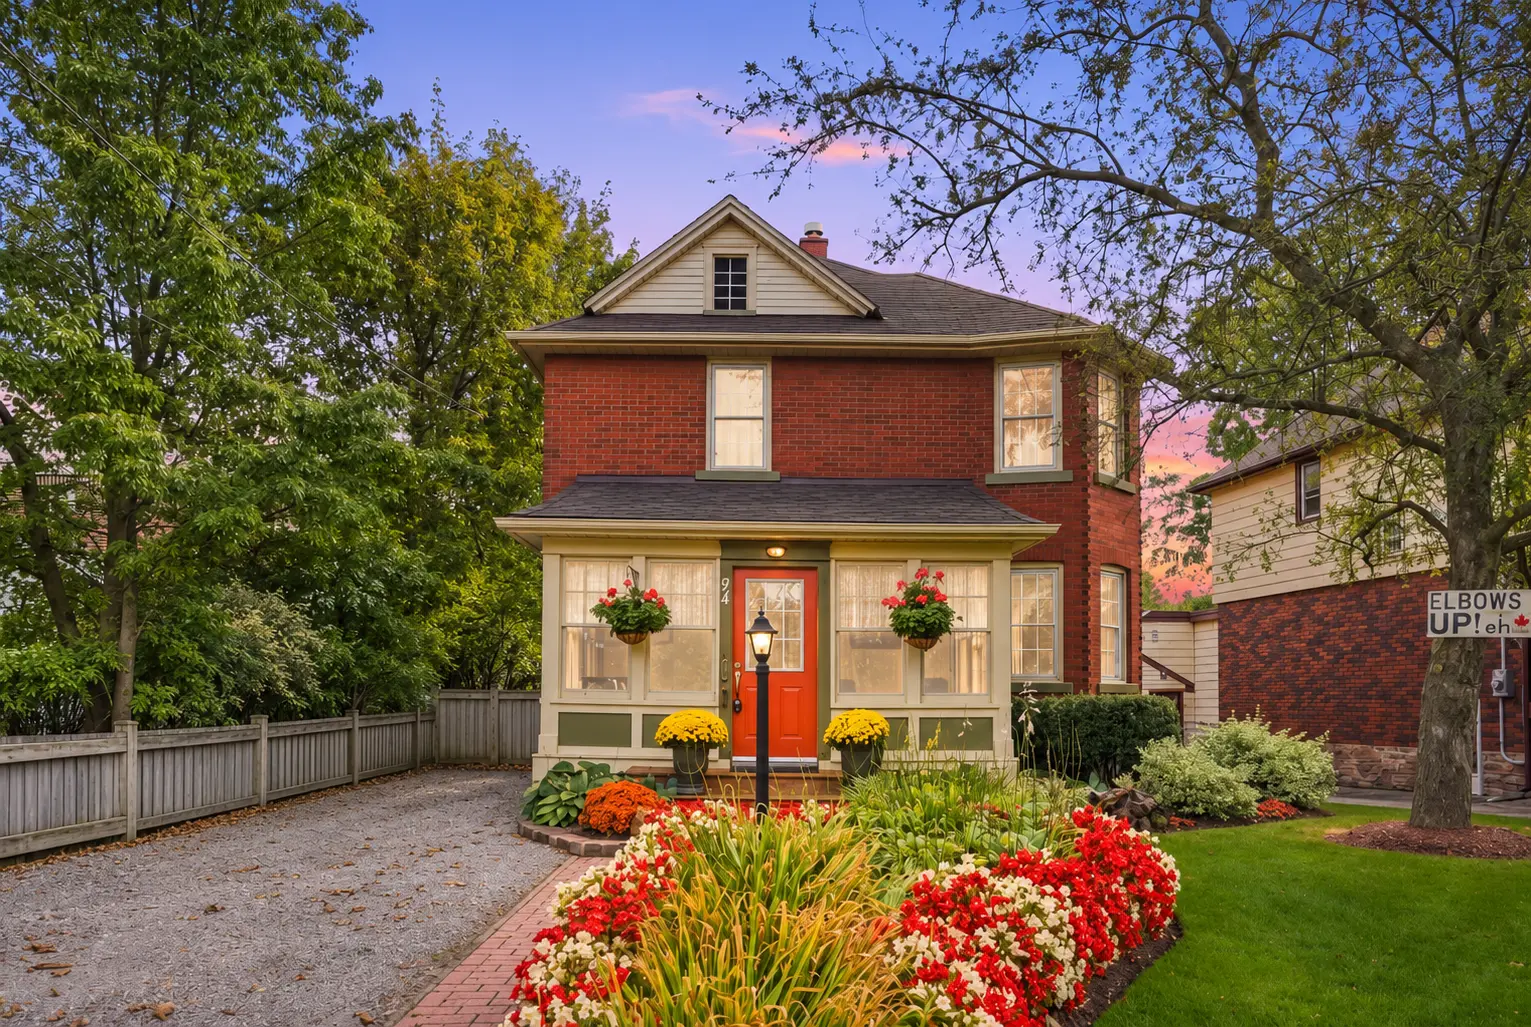
Niagara community breakdown
Prices are October MLS® benchmark prices. The price and sales changes compare October 2026 with October 2025.
| Community | Benchmark price | Price change | October sales | Sales change |
|---|---|---|---|---|
| Fort Erie | $490,200 | −5.4% | 38 | −26.9% |
| Grimsby | $679,200 | −2.5% | 38 | +31.0% |
| Lincoln | $653,900 | −8.4% | 33 | +26.9% |
| Niagara Falls | $553,700 | −4.4% | 102 | −2.9% |
| Niagara-on-the-Lake | $843,600 | −5.3% | 27 | +8.0% |
| Pelham | $724,500 | −4.0% | 24 | +14.3% |
| Port Colborne/Wainfleet | $474,900 | −4.7% | 19 | −9.5% |
| St. Catharines | $523,800 | −2.1% | 114 | −8.1% |
| Thorold | $548,100 | −8.5% | 33 | −13.2% |
| Welland | $480,000 | −3.5% | 73 | +23.7% |
| West Lincoln | $665,300 | +1.5% | 11 | −21.4% |
Niagara’s overall sales count was nearly flat, but that played out differently from one community to the next. Welland went from 59 to 73 sales, while St. Catharines went from 124 to 114. West Lincoln was the only community in the report where the benchmark price rose year over year. Niagara’s municipal breakdown
In the News
The Bank of Canada raised its policy rate by a quarter point to 2.50% on October 28, its first increase since July 2023. September inflation was 3.1%, or 2.2% excluding gasoline, and the Bank said its core measures were close to 2%. Governing Council raised the rate because it saw a risk that persistently higher energy costs could spread to other goods and services. Bank of Canada rate decision · Statistics Canada inflation report
Real GDP was essentially flat in July and August. In October, employment was little changed and Canada’s unemployment rate rose to 6.7%. Statistics Canada GDP report · October Labour Force Survey
My Take
Whenever rates move by a quarter point, there’s a lot of focus on what it means for real estate. What I’m watching first is confidence. Does the headline make someone put off a decision they were ready to make? So far, it hasn’t been a major factor in our conversations with clients. The decision came near the end of October, so I’ll be watching how buyers respond over the next few months.
The bigger local story for me is supply. We’re well into the fall, and the wave of new listings I was watching for hasn’t arrived. If that continues into the winter, we could enter 2027 with fewer sellers competing for the same buyers. A Canada–U.S. trade agreement, if one comes together, could also help restore some confidence.
For buyers, I think this is one of the better opportunities we’ve seen in years, especially if you’re buying your first home. Prices have adjusted in many communities, and we’re already seeing competition for well-priced homes at the entry level. Know your budget and pay close attention to what’s happening in the neighbourhoods and price range you’re looking at.
For sellers, fewer competing listings can help your home stand out. Homes are moving when they’re priced for today’s market, presented well, and marketed properly. If you want to sell before year-end, now is the time to talk through your options. If January is your goal, the next few weeks are a good time to get a home evaluation and start preparing.
If you’re thinking about buying or selling, give us a call at 1-844-484-SOLD or visit MichaelStJean.com.